Produkte
Examples of current products from scilands GmbH
Our range of products, methods, and services is extensive. Further information can be found linked in the respective headings. In addition to our classic software portfolio, we also offer courses on using SAGA-GIS and QGIS for beginners and advanced users.
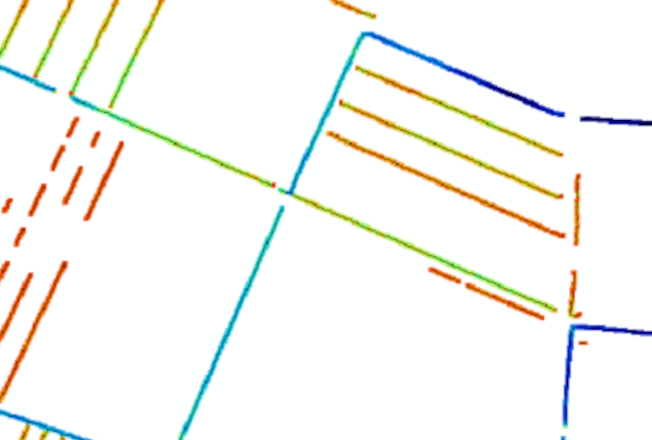
Location and depth of drainage ditches
The condition and flow rates of drainage ditches are significant indicators of peatland quality. Therefore, evaluating the location, depth, and thus the flow rate of ditches must be part of a comprehensive peatland assessment. Scilands GmbH is dedicated to this task and has developed a powerful GIS tool for this purpose. Based on high-resolution digital terrain models, we can locate ditch structures with high precision and automatically derive their depth. We utilize proprietary relief parameters such as "symmetric relief energy." The next development phase will involve the calibration and validation of the model.
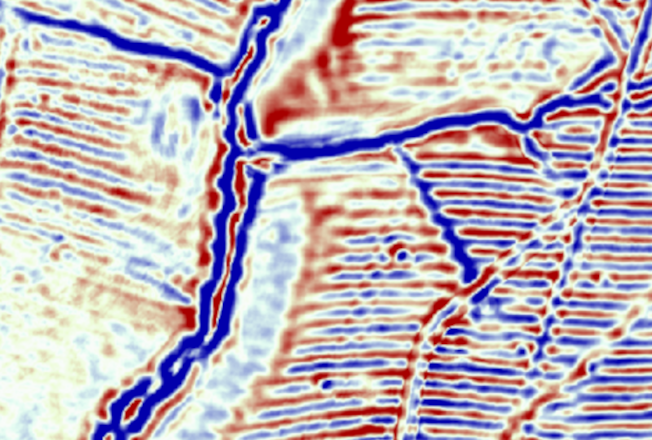
Archive floor surface forms in Lower Saxony
Following the completion of the "Feasibility Study for DTM-Based Detection of Archival Soil Surface Landforms (ARBOF)" for Lower Saxony, we are now looking forward to the actual implementation of this exciting project. Archival soils can represent significant monuments that preserve valuable information about natural and cultural history. However, they are sometimes heavily altered or even destroyed, and difficult to identify in the field. In the coming months, Scilands will automatically derive these landforms from digital terrain models and modified parameters throughout the state. The report can be obtained from the
PresentationSoil protection, soil survey of the state by the LBEG can be requested.
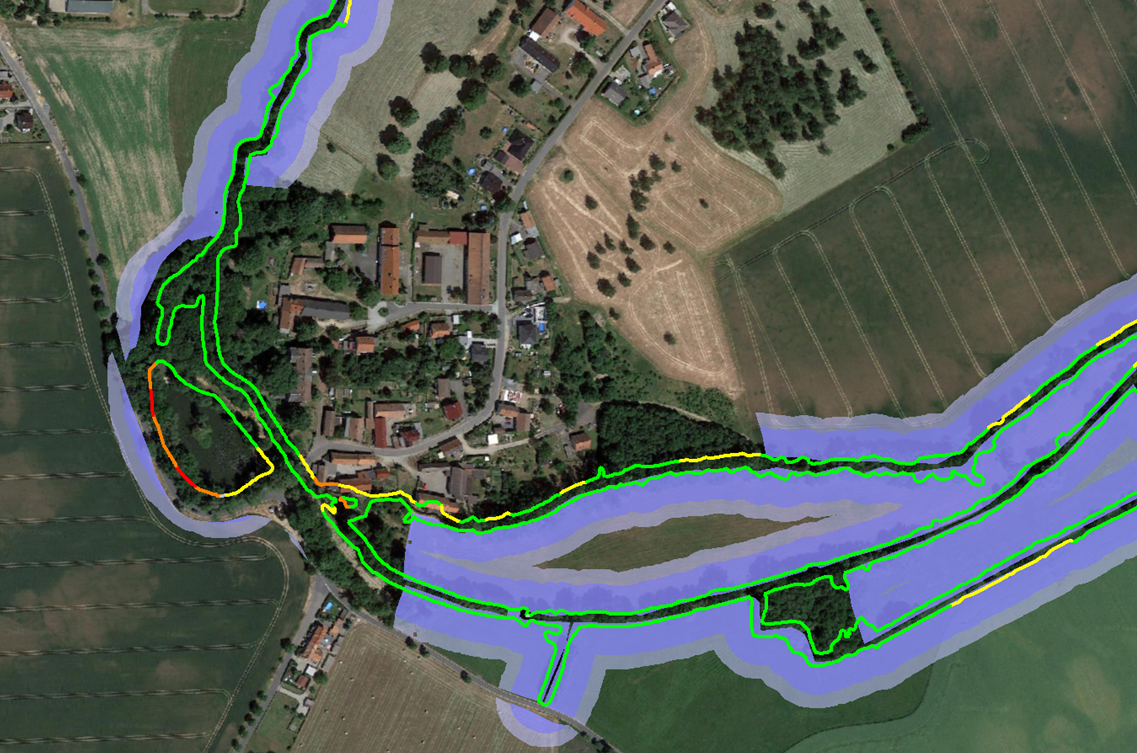
Survey of embankment tops and riparian buffer strips
The revised Water Resources Act and the provisions of the Fertiliser Ordinance necessitate the designation of "slope tops" and "riparian buffer zones" and corresponding buffer areas, with potential impacts on agricultural land. Scilands GmbH has developed process chains for the automated derivation of these reference lines from digital elevation models. These are objective, reproducible, and highly accurate. Since the positional accuracy of official watercourse networks is rarely sufficient, these networks must be recreated (see the following section).
Technical article (Link) in Water and Waste | Issue 9/2025.
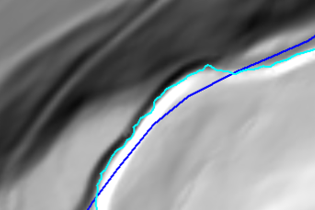
Creation and optimization of river geometries
Digital elevation models are now available at very high spatial resolutions in the meter or even centimeter range, thanks to laser technologies. However, the spatial accuracy of the available digital river networks has not kept pace; significant discrepancies sometimes arise between geodata layers. This leads to problems, for example, in deriving bank tops. Scilands GmbH has therefore developed a method that generates precise river replacement geometries based on high-resolution elevation models and existing river data.
Geomorphometric relief parameters
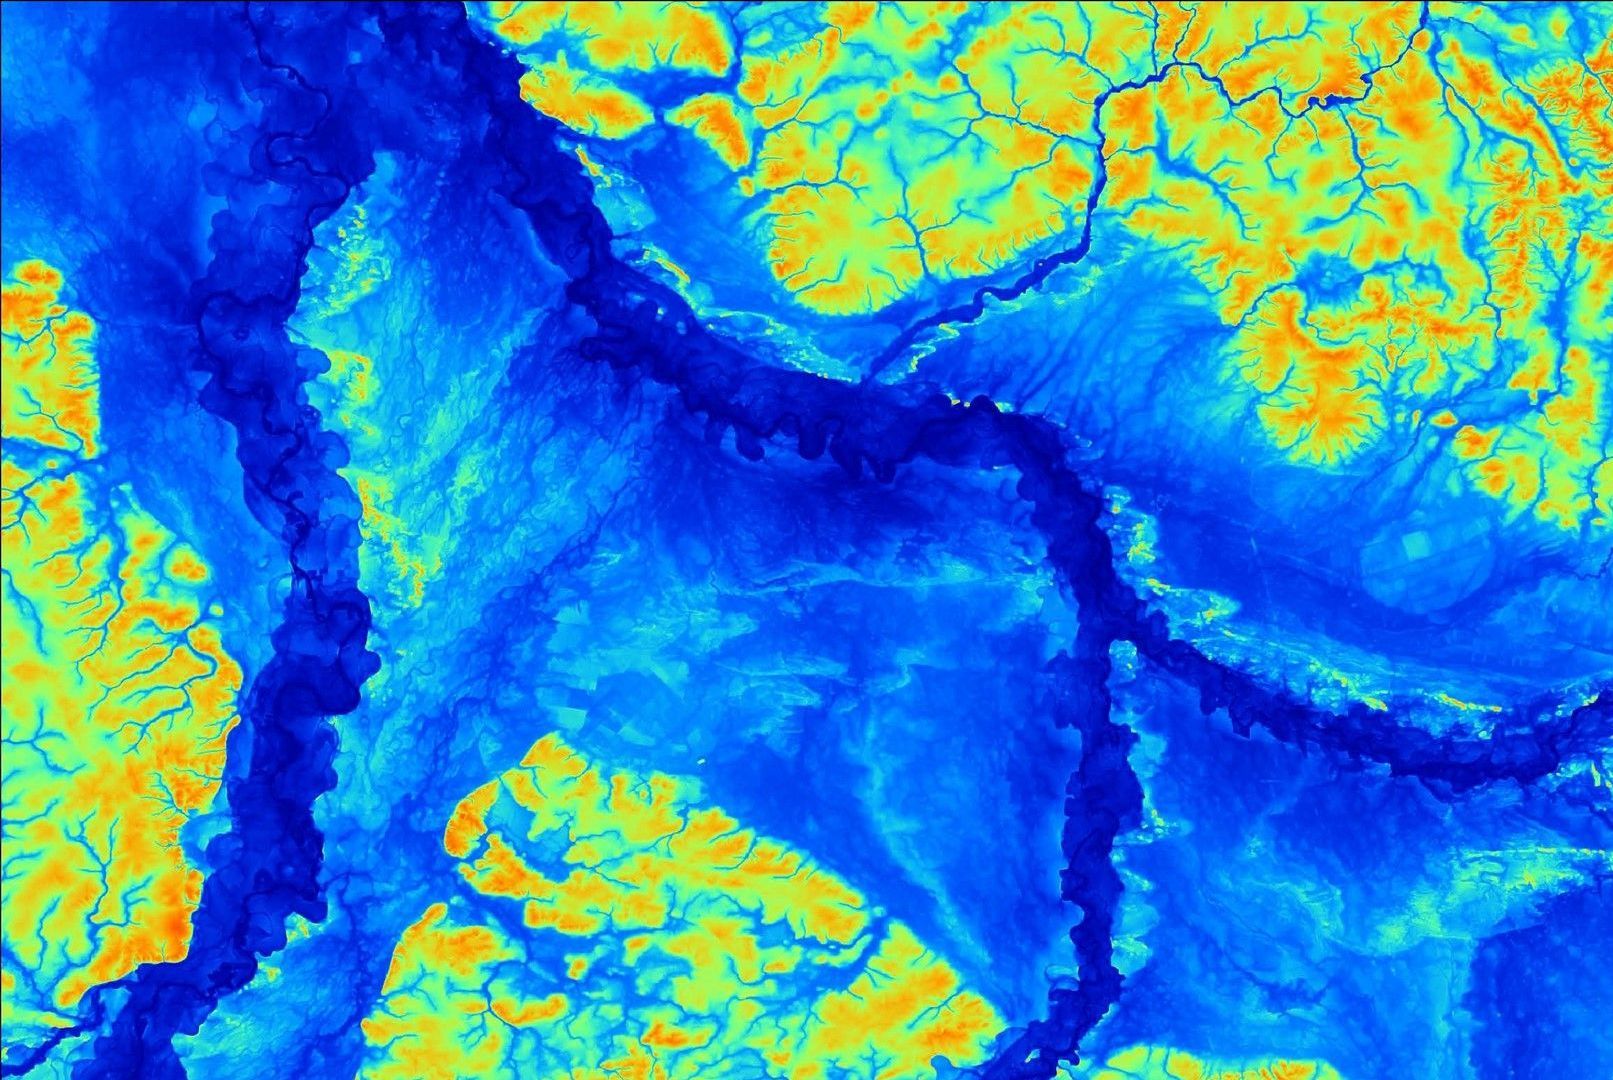
Relief analysis based on digital terrain models (DTMs) has become firmly established in environmental science for the analysis and modeling of spatial data. In soil science, this range of applications has become established in the form of relief parameters specifically designed to depict the distribution of soil characteristics, and the delineation of relief units has also developed considerably. The latter now enables the improved and more objective recording of soil-homogeneous areas, while the former can be used for plausible estimations of the distribution of specific soil parameters.
Modeling terrestrial water balance levels
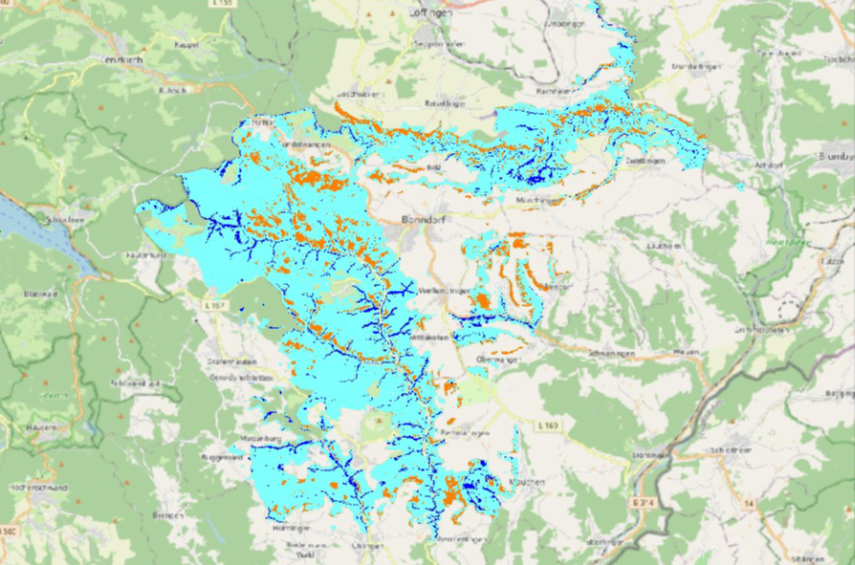
A robust and realistic model of the water balance based on relief characteristics and soil analyses is essential for the scientific and economic assessment of site quality in forestry. Against the backdrop of climate change, estimating the average water available to plants becomes even more crucial. Therefore, the regionalization of point data across large and heterogeneous areas is carried out using GIS and statistical methods, which are employed to model and map the terrestrial water balance levels of forest site mapping.
Creation and optimization of digital elevation models (DEMs)
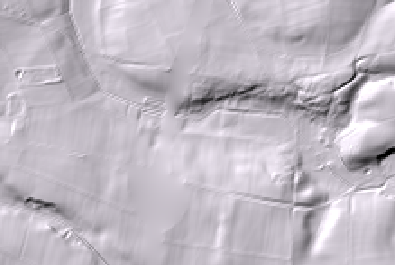
Digital terrain models (DTMs) of real terrain elevations and surface models (SSMs), including all objects above the Earth's surface, are indispensable today for the spatially explicit modeling of processes and parameters. Scilands GmbH creates raster elevation models from elevation points or processes existing rasters for further processing. Classic applications include the preparation and enhancement of DTMs, elevation correction for water or arable land with vegetation, resampling of raster spacing, elimination of anthropogenic relief features, and the processing of radar terrain models using integrated X- and C-band SAR data, etc.
Modeling of peatland distribution and depth
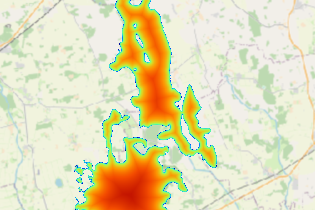
The three-dimensional modeling of the distribution and thickness of carbon-rich soils and peatlands places high demands on the selection of the appropriate methodology and processing. Different ecological conditions, the developmental history, past and present land use, and a multitude of specific parameters, such as the depth to groundwater, must be incorporated into the workflow. Scilands GmbH has developed procedures for deriving peatland sizes, forms, and depths from historical and recent spatial data as well as soil databases; these procedures are currently being used in two German states.
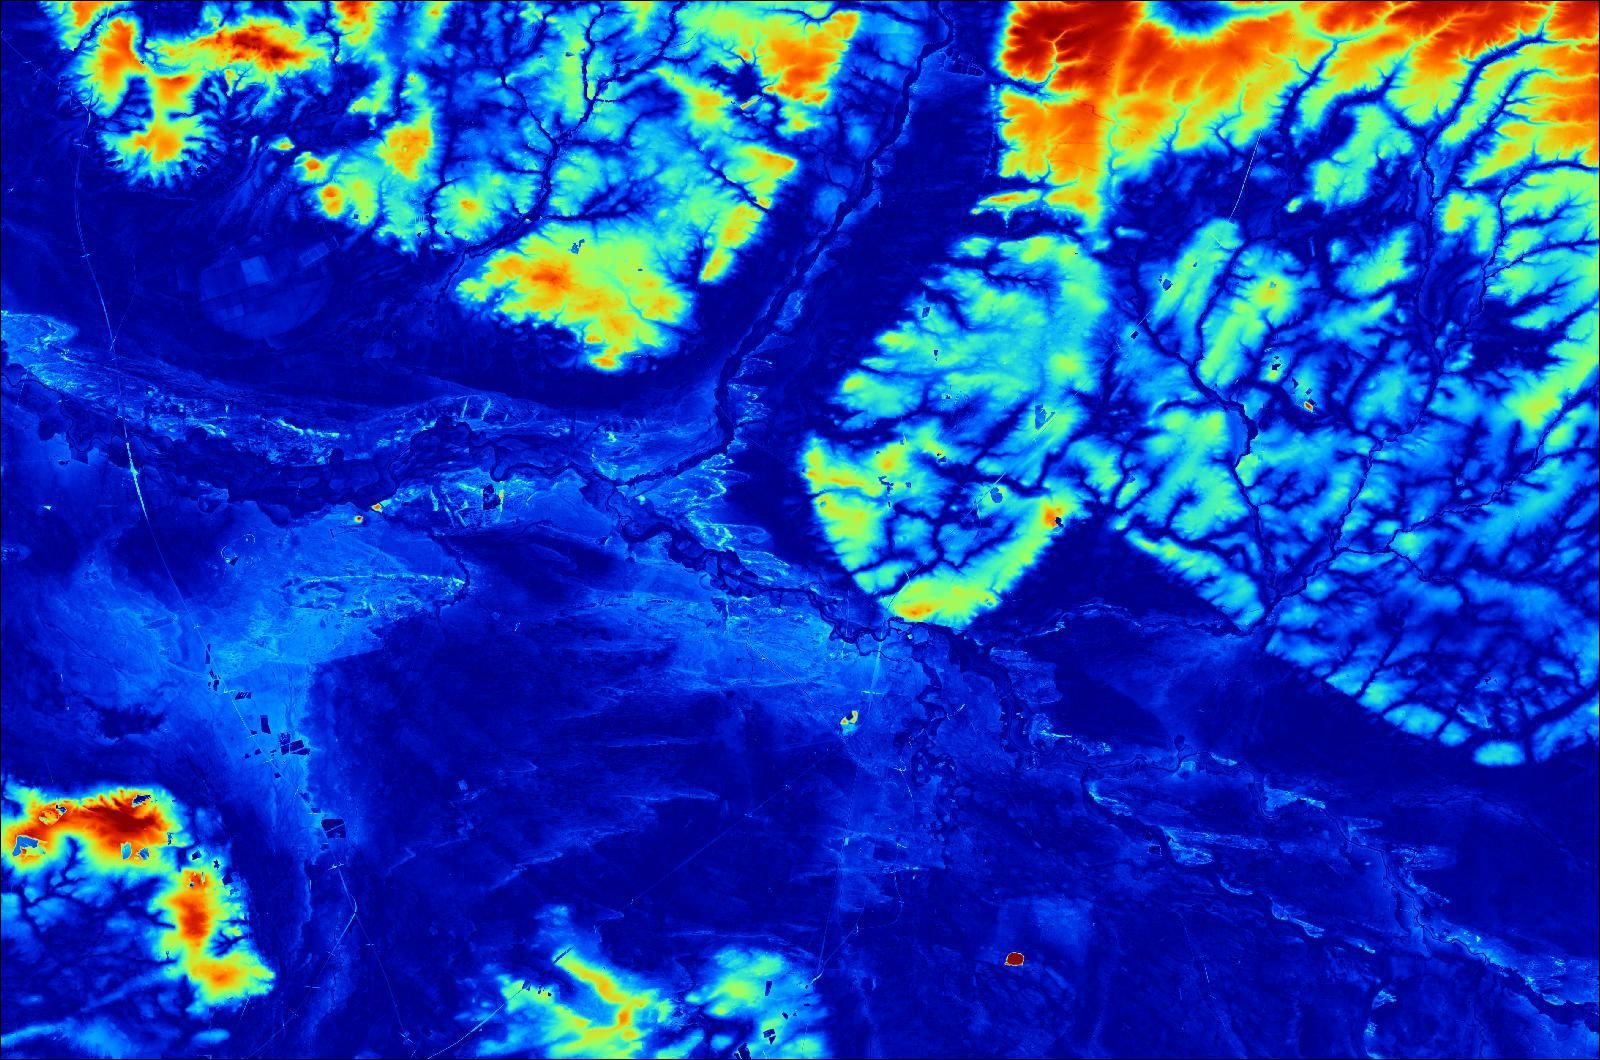
Modeling of groundwater levels
Based on digital terrain models (DTMs) and watercourse networks, the potentially natural maximum and minimum groundwater levels (or groundwater depths) of the uppermost aquifer can be modeled. The modeling assumes near-surface unconsolidated sediments. The influence of tidal range (e.g., on the North Sea coast), barrier rocks (glacial till), and groundwater dynamics in large floodplains can be incorporated. However, the modeling is not valid in areas with near-surface bedrock. The modeled groundwater levels can be used in a variety of other models.
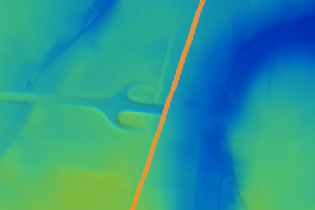
Removal of anthropogenic relief features from elevation models
Anthropogenic features in digital elevation models (DEMs), such as bridges, dams, or road cuttings, appear as barriers in the raster model, even though they do not exist in reality. This is because only the elevation of the uppermost object, in our example the highway, is considered in the DEM; the free flow beneath the bridge cannot be represented in the model. The bridge thus effectively acts as a dam, which must be opened to model surface runoff in order to enable a realistic representation of hydrologically and pedologically relevant parameters. Our example shows the section of the Bockenem interchange on the A7 motorway in DEM10.
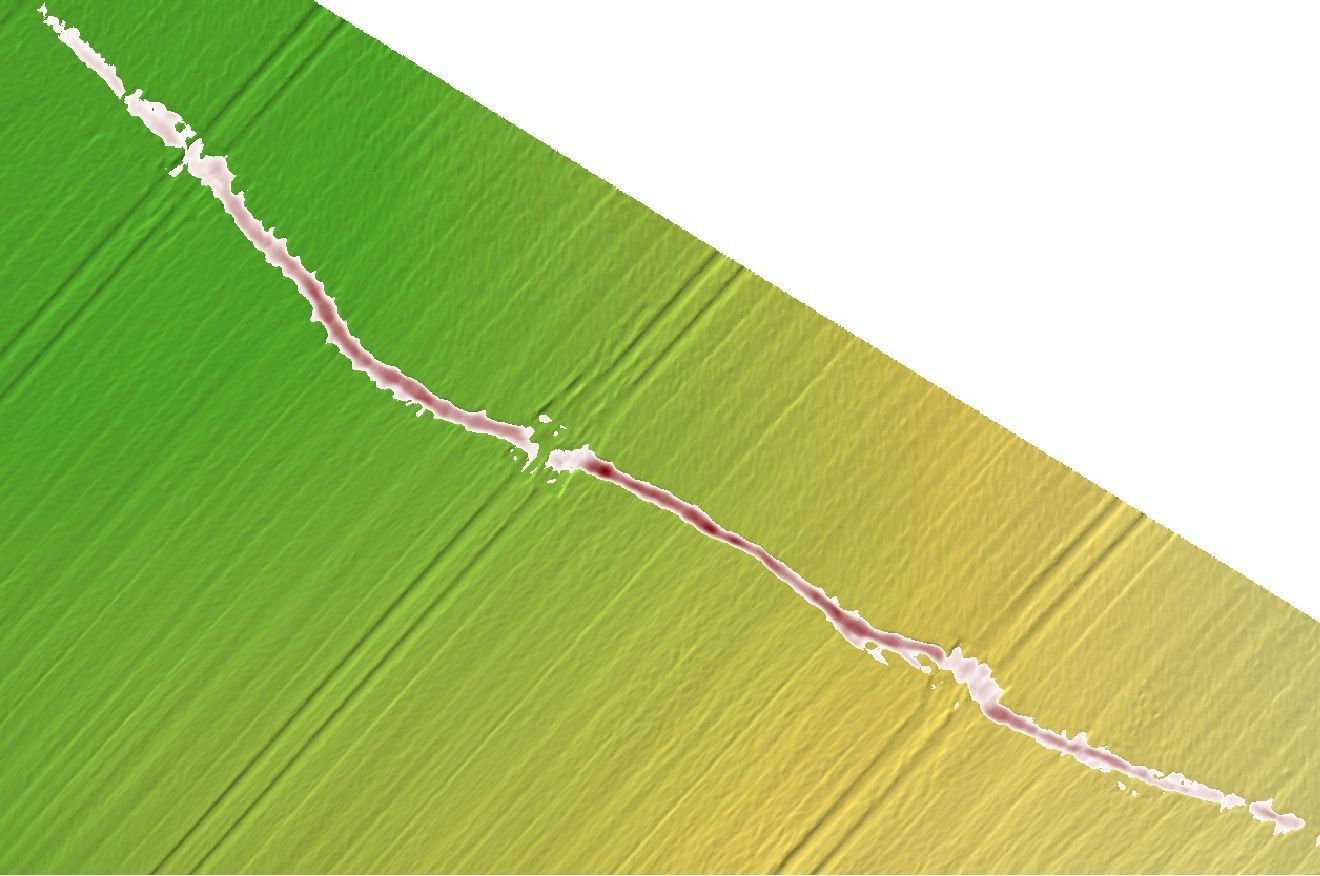
Calculation of soil losses through erosion gullies after heavy rainfall
Scilands GmbH has developed a method for calculating soil loss due to erosion gullies after heavy rainfall. These erosion events, mostly on agricultural land, constitute "harmful soil changes due to water erosion" as defined by the German Federal Soil Protection and Contaminated Sites Ordinance (BBodSchV). The calculation of soil loss is based on a high-resolution digital terrain model (DTM) with a grid resolution of approximately 10 cm. The DTM is created using photogrammetric analysis of drone aerial photographs taken immediately after the erosion event. Therefore, no before-and-after comparison is necessary.
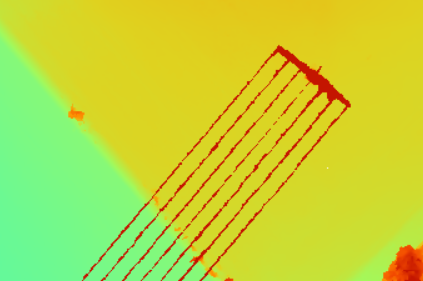
Removal of overhead power lines from surface models
High-resolution, aerial imagery-based surface models now achieve such high spatial resolution that even power lines are visible. This results in a significant problem: In the logic of the raster model, the lines don't hang freely in the air, but rather form the highest point of narrow ridges. These artifacts crisscross the landscape like walls, interrupting, for example, the flow of water. The algorithm developed by Scilands GmbH allows these unwanted obstacles to be removed completely and reliably. This is absolutely essential for accurate ecological modeling and landscape planning.
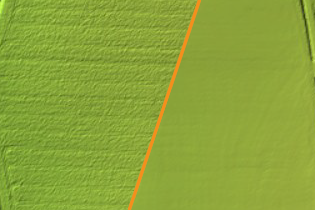
Filtering of vegetation signals on arable land
The presence of crops on arable land is noticeable in surface models due to significant noise. Furthermore, the vegetation essentially forms the virtual surface; for example, in the case of a cornfield, the difference to the actual terrain surface can be considerable. This leads to problems and misinterpretations when modeling surface-based parameters and processes. Therefore, the vegetation surface must be removed from the digital terrain model (DTM). This is achieved by lowering the affected elevation values and then smoothing them. The specific amount of lowering is calculated for each field based on the "negative symmetric relief energy."
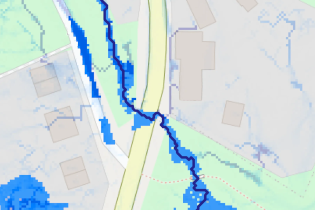
Potential flood zones as a result of heavy rainfall
Heavy rainfall events are expected to increase significantly in the coming years and decades due to climate change, and with them the risk of catastrophic flood damage. These events often occur in areas where they would not have been anticipated, making the consequences all the more severe. Products for heavy rainfall risk management are therefore in high demand among insurance companies and municipalities. Scilands can reliably identify depressions and runoff paths, thus making areas with high hazard potential visible. Unfortunately, this is a very topical and important issue.
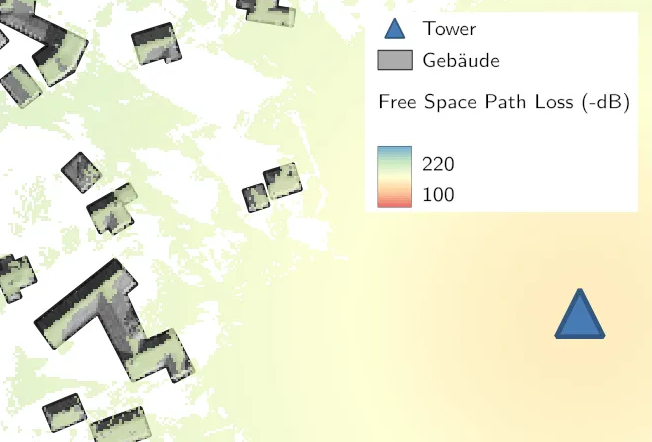
Creation of microwave radio coverage maps (address quality checker)
Many internet providers use microwave links to connect remote communities. The signal quality depends on a variety of factors, including the height of the masts, the unobstructed line of sight between transmitter and receiver, and, of course, the quality of the installed equipment. Based on digital surface models and the hardware used by the providers, Scilands calculates the network coverage of radio towers or entire tower clusters on behalf of clients. A database stores information for each house, such as signal quality, the location of the nearest tower or suitable alternatives, and similar data.
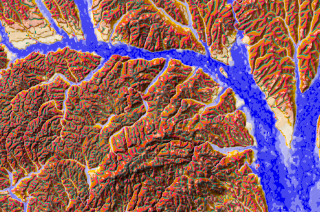
Scilands and e-SOTER: From terrain model to world soil map
As a partner in the EU-funded e-SOTER project, Scilands GmbH played a key role in paving the way for a modern, global digital soil map. Our technological contribution lay in the specialized analysis of high-resolution digital terrain models to precisely capture and geomorphologically characterize soil landscapes. Furthermore, parameterized data on soil parent material were combined with relief data to also represent this soil formation factor. Our technology contributed to the successful implementation of this groundbreaking project.
WebGIS programming and hosting
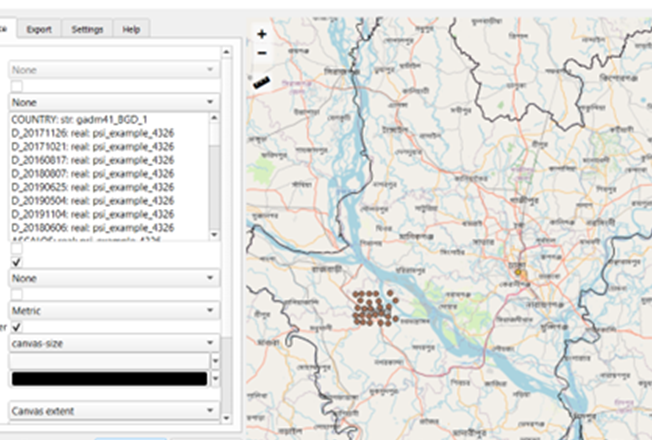
WebGIS applications for displaying, analyzing, and managing geodata offer diverse applications for a wide range of purposes. Scilands GmbH develops intuitive mapserver applications based on open-source software and in accordance with the standards of the Open Geospatial Consortium, tailored to specific requirements. External servers for data storage and maintenance can be set up and maintained upon request. This allows you to make your data available to a large number of users or to restrict access to a small, password-protected group.

Other products...
Other products of scilands GmbH include, for example, the processing of soil maps and data at the state level, such as the creation of so-called ideal profiles, i.e., prototypical soil profiles, for abstracting legend units for the creation of small-scale soil maps (in cooperation with
Soil mapping Melms) or the provision of database clients for creating a geological analysis tool. Basically, anything that can be derived from geodata is conceivable. Please feel free to contact us directly with any questions. Our diverse team will certainly find a solution that meets your needs and requirements.
Other projects...
Training from Open-Source GIS
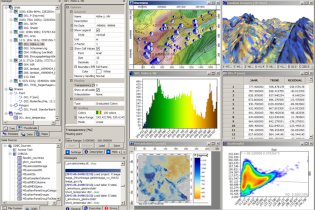
We offer training courses on freely available computer programs in the field of Geographic Information Systems (GIS), including high-quality applications such as SAGA-GIS. In line with the open-source approach to software, we focus on the use of freely accessible geodata, such as the SRTM elevation model or optical satellite imagery from Landsat and Sentinel-2. All courses include a theoretical introduction to GIS and specialized topics, as well as, most importantly, practical exercises. In addition to courses on specific topics, we also offer introductory courses.
Basics for illustrations:
Extract from the geodata of the State Office for Geoinformation and Land Surveying of Lower Saxony 2022
(www.lgln.de) *** GEOSN, 2019, License:
dl-de/by-2-0, geodaten.sachsen.de ***
Base maps: © Google Maps (2021), https://maps.google.com and © OpenStreetMap contributors (https://www.openstreetmap.org/). Maps are subject to the Open Database License (ODbL) *** SAGA: (Conrad, O., Bechtel, B., Bock, M., Dietrich, H., Fischer, E., Gerlitz, L., Wehberg, J., Wichmann, V., and Böhner, J. (2015): System for Automated Geoscientific Analyses (SAGA) v. 2.1.4, Geosci. Model Dev., 8, 1991-2007, doi:10.5194/gmd-8-1991-2015)